<< Tilbage til sammenligning af EU-stemmer
Sammenligning af stemmeafgivelser i Europa-parlamentet
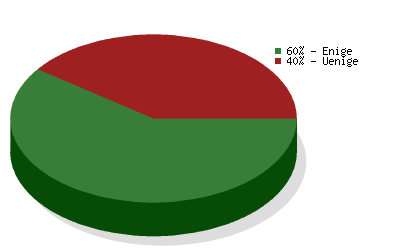
 Socialistisk Folkeparti
vs.
Venstre
Socialistisk Folkeparti
vs.
Venstre 
Sammenligning af stemmeafgivelser i Europa-parlamentet
Sammenligningen er baseret på
5176 afstemninger
og dækker valgperiode 2004-2009
og dækker valgperiode 2004-2009
| Politikområde | Grad af enighed | Antal afstemninger |
|---|---|---|
| Environment, Public Health and Food Safety | 49 % | 536 |
| Budgets | 73 % | 367 |
| Foreign Affairs | 68 % | 355 |
| Civil Liberties, Justice and Home Affairs | 75 % | 306 |
| Economic and Monetary Affairs | 40 % | 288 |
| Agriculture | 58 % | 270 |
| Industry, Research and Energy | 49 % | 251 |
| Transport and Tourism | 56 % | 245 |
| Internal Market and Consumer Protection | 35 % | 222 |
| Constitutional Affairs | 76 % | 200 |
| Employment and Social Affairs | 56 % | 187 |
| Budgetary Control | 93 % | 183 |
| EP Delegation to Conciliation | 57 % | 141 |
| International Trade | 47 % | 141 |
| Legal Affairs | 78 % | 138 |
| Culture and Education | 63 % | 134 |
| Regional Development | 56 % | 118 |
| Fisheries | 52 % | 105 |
| Women's Rights and Gender Equality | 73 % | 88 |
| Development | 82 % | 74 |
| The enlarged Union for 2007-2013 | 70 % | 33 |
| Petitions | 83 % | 23 |
| Use of European countries by the CIA | 60 % | 20 |
| Climate Change | 75 % | 16 |