<< Tilbage til sammenligning af EU-stemmer
Sammenligning af stemmeafgivelser i Europa-parlamentet
 Dansk Folkeparti
vs.
Socialistisk Folkeparti
Dansk Folkeparti
vs.
Socialistisk Folkeparti 
Sammenligning af stemmeafgivelser i Europa-parlamentet
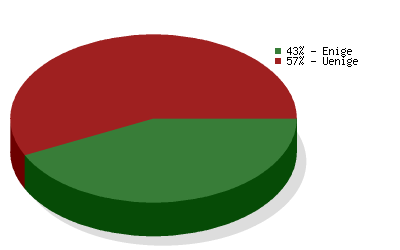
Sammenligningen er baseret på
5087 afstemninger
og dækker valgperiode 2004-2009
og dækker valgperiode 2004-2009
| Politikområde | Grad af enighed | Antal afstemninger |
|---|---|---|
| Environment, Public Health and Food Safety | 58 % | 527 |
| Foreign Affairs | 33 % | 364 |
| Budgets | 32 % | 325 |
| Civil Liberties, Justice and Home Affairs | 26 % | 305 |
| Economic and Monetary Affairs | 26 % | 296 |
| Industry, Research and Energy | 41 % | 251 |
| Agriculture | 51 % | 247 |
| Transport and Tourism | 60 % | 240 |
| Internal Market and Consumer Protection | 63 % | 225 |
| Constitutional Affairs | 18 % | 206 |
| Budgetary Control | 49 % | 181 |
| Employment and Social Affairs | 41 % | 180 |
| EP Delegation to Conciliation | 68 % | 142 |
| International Trade | 30 % | 142 |
| Culture and Education | 35 % | 130 |
| Legal Affairs | 67 % | 126 |
| Regional Development | 35 % | 118 |
| Fisheries | 47 % | 108 |
| Women's Rights and Gender Equality | 59 % | 90 |
| Development | 51 % | 75 |
| Use of European countries by the CIA | 24 % | 41 |
| The enlarged Union for 2007-2013 | 47 % | 34 |
| Petitions | 59 % | 22 |
| Climate Change | 31 % | 16 |