<< Tilbage til sammenligning af EU-stemmer
Sammenligning af stemmeafgivelser i Europa-parlamentet
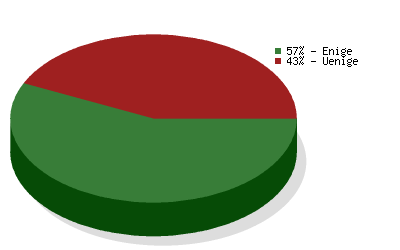
 Socialistisk Folkeparti
vs.
JuniBevægelsen
Socialistisk Folkeparti
vs.
JuniBevægelsen 
Sammenligning af stemmeafgivelser i Europa-parlamentet
Sammenligningen er baseret på
4857 afstemninger
og dækker valgperiode 2004-2009
og dækker valgperiode 2004-2009
| Politikområde | Grad af enighed | Antal afstemninger |
|---|---|---|
| Environment, Public Health and Food Safety | 80 % | 526 |
| Budgets | 36 % | 337 |
| Foreign Affairs | 47 % | 330 |
| Economic and Monetary Affairs | 43 % | 283 |
| Civil Liberties, Justice and Home Affairs | 65 % | 279 |
| Agriculture | 42 % | 243 |
| Transport and Tourism | 62 % | 231 |
| Industry, Research and Energy | 62 % | 227 |
| Internal Market and Consumer Protection | 72 % | 218 |
| Constitutional Affairs | 24 % | 197 |
| Employment and Social Affairs | 48 % | 178 |
| Budgetary Control | 76 % | 174 |
| EP Delegation to Conciliation | 58 % | 137 |
| International Trade | 51 % | 132 |
| Culture and Education | 44 % | 125 |
| Legal Affairs | 71 % | 119 |
| Regional Development | 45 % | 107 |
| Fisheries | 53 % | 95 |
| Women's Rights and Gender Equality | 78 % | 83 |
| Development | 80 % | 71 |
| Use of European countries by the CIA | 51 % | 35 |
| The enlarged Union for 2007-2013 | 44 % | 32 |
| Petitions | 55 % | 22 |