<< Tilbage til sammenligning af EU-stemmer
Sammenligning af stemmeafgivelser i Europa-parlamentet
 Socialdemokraterne
vs.
Dansk Folkeparti
Socialdemokraterne
vs.
Dansk Folkeparti 
Sammenligning af stemmeafgivelser i Europa-parlamentet
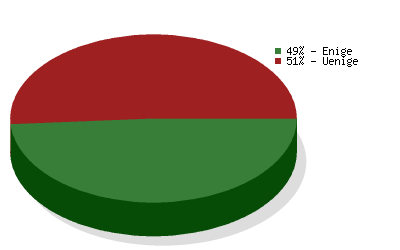
Sammenligningen er baseret på
5397 afstemninger
og dækker valgperiode 2004-2009
og dækker valgperiode 2004-2009
| Politikområde | Grad af enighed | Antal afstemninger |
|---|---|---|
| Environment, Public Health and Food Safety | 65 % | 545 |
| Foreign Affairs | 43 % | 390 |
| Budgets | 31 % | 341 |
| Civil Liberties, Justice and Home Affairs | 36 % | 321 |
| Economic and Monetary Affairs | 31 % | 300 |
| Transport and Tourism | 61 % | 273 |
| Industry, Research and Energy | 70 % | 251 |
| Budgetary Control | 40 % | 230 |
| Internal Market and Consumer Protection | 64 % | 224 |
| Constitutional Affairs | 29 % | 216 |
| Agriculture | 52 % | 211 |
| Employment and Social Affairs | 40 % | 192 |
| EP Delegation to Conciliation | 62 % | 156 |
| International Trade | 58 % | 140 |
| Legal Affairs | 70 % | 140 |
| Culture and Education | 41 % | 138 |
| Regional Development | 49 % | 131 |
| Fisheries | 56 % | 108 |
| Women's Rights and Gender Equality | 62 % | 94 |
| Development | 56 % | 85 |
| Use of European countries by the CIA | 38 % | 40 |
| The enlarged Union for 2007-2013 | 38 % | 32 |
| Petitions | 73 % | 22 |
| Climate Change | 33 % | 15 |