<< Tilbage til sammenligning af EU-stemmer
Sammenligning af stemmeafgivelser i Europa-parlamentet
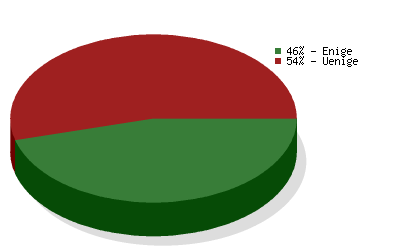
 Det Radikale Venstre
vs.
JuniBevægelsen
Det Radikale Venstre
vs.
JuniBevægelsen 
Sammenligning af stemmeafgivelser i Europa-parlamentet
Sammenligningen er baseret på
3992 afstemninger
og dækker valgperiode 2004-2009
og dækker valgperiode 2004-2009
| Politikområde | Grad af enighed | Antal afstemninger |
|---|---|---|
| Environment, Public Health and Food Safety | 55 % | 376 |
| Budgets | 35 % | 279 |
| Foreign Affairs | 44 % | 247 |
| Economic and Monetary Affairs | 37 % | 240 |
| Civil Liberties, Justice and Home Affairs | 51 % | 223 |
| Budgetary Control | 71 % | 218 |
| Transport and Tourism | 48 % | 205 |
| Industry, Research and Energy | 43 % | 198 |
| Employment and Social Affairs | 41 % | 179 |
| Agriculture | 43 % | 162 |
| EP Delegation to Conciliation | 60 % | 143 |
| Legal Affairs | 61 % | 126 |
| Constitutional Affairs | 31 % | 125 |
| Regional Development | 34 % | 110 |
| Culture and Education | 39 % | 105 |
| International Trade | 46 % | 97 |
| Internal Market and Consumer Protection | 45 % | 93 |
| Fisheries | 38 % | 85 |
| Women's Rights and Gender Equality | 58 % | 74 |
| Development | 73 % | 55 |
| The enlarged Union for 2007-2013 | 41 % | 32 |
| Petitions | 45 % | 20 |
| Use of European countries by the CIA | 20 % | 15 |