<< Tilbage til sammenligning af EU-stemmer
Sammenligning af stemmeafgivelser i Europa-parlamentet
 Dansk Folkeparti
vs.
Det Radikale Venstre
Dansk Folkeparti
vs.
Det Radikale Venstre 
Sammenligning af stemmeafgivelser i Europa-parlamentet
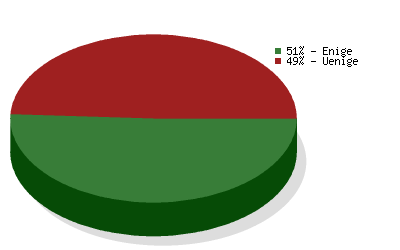
Sammenligningen er baseret på
4360 afstemninger
og dækker valgperiode 2004-2009
og dækker valgperiode 2004-2009
| Politikområde | Grad af enighed | Antal afstemninger |
|---|---|---|
| Environment, Public Health and Food Safety | 60 % | 387 |
| Budgets | 37 % | 300 |
| Foreign Affairs | 48 % | 269 |
| Economic and Monetary Affairs | 49 % | 251 |
| Civil Liberties, Justice and Home Affairs | 40 % | 249 |
| Industry, Research and Energy | 64 % | 224 |
| Budgetary Control | 43 % | 223 |
| Transport and Tourism | 60 % | 220 |
| Employment and Social Affairs | 42 % | 180 |
| Agriculture | 64 % | 169 |
| EP Delegation to Conciliation | 60 % | 147 |
| Legal Affairs | 63 % | 134 |
| Constitutional Affairs | 28 % | 133 |
| Regional Development | 43 % | 124 |
| Culture and Education | 37 % | 109 |
| International Trade | 67 % | 108 |
| Internal Market and Consumer Protection | 69 % | 101 |
| Fisheries | 46 % | 98 |
| Women's Rights and Gender Equality | 51 % | 76 |
| Development | 61 % | 59 |
| The enlarged Union for 2007-2013 | 29 % | 34 |
| Petitions | 48 % | 21 |
| Use of European countries by the CIA | 44 % | 18 |
| Climate Change | 38 % | 16 |