<< Tilbage til sammenligning af EU-stemmer
Sammenligning af stemmeafgivelser i Europa-parlamentet
 Socialdemokraterne
vs.
Det Konservative Folkeparti
Socialdemokraterne
vs.
Det Konservative Folkeparti 
Sammenligning af stemmeafgivelser i Europa-parlamentet
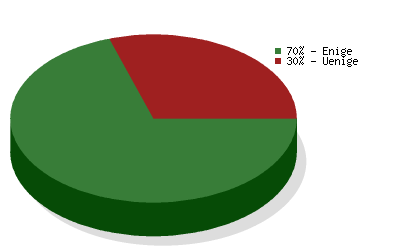
Sammenligningen er baseret på
4124 afstemninger
og dækker valgperiode 2004-2009
og dækker valgperiode 2004-2009
| Politikområde | Grad af enighed | Antal afstemninger |
|---|---|---|
| Environment, Public Health and Food Safety | 75 % | 369 |
| Foreign Affairs | 77 % | 297 |
| Civil Liberties, Justice and Home Affairs | 67 % | 254 |
| Industry, Research and Energy | 73 % | 230 |
| Budgetary Control | 89 % | 220 |
| Budgets | 69 % | 219 |
| Economic and Monetary Affairs | 47 % | 211 |
| Transport and Tourism | 70 % | 204 |
| Internal Market and Consumer Protection | 73 % | 188 |
| Agriculture | 66 % | 166 |
| Employment and Social Affairs | 51 % | 158 |
| EP Delegation to Conciliation | 63 % | 128 |
| Legal Affairs | 83 % | 127 |
| Culture and Education | 76 % | 120 |
| Regional Development | 77 % | 115 |
| Constitutional Affairs | 77 % | 111 |
| Fisheries | 84 % | 88 |
| International Trade | 78 % | 81 |
| Women's Rights and Gender Equality | 57 % | 77 |
| Development | 91 % | 47 |
| The enlarged Union for 2007-2013 | 75 % | 32 |
| Petitions | 74 % | 19 |
| Use of European countries by the CIA | 72 % | 18 |
| Climate Change | 47 % | 15 |