<< Tilbage til sammenligning af EU-stemmer
Sammenligning af stemmeafgivelser i Europa-parlamentet
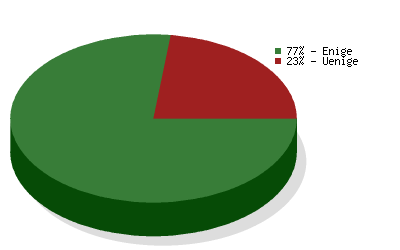
 Venstre
vs.
Det Konservative Folkeparti
Venstre
vs.
Det Konservative Folkeparti 
Sammenligning af stemmeafgivelser i Europa-parlamentet
Sammenligningen er baseret på
4367 afstemninger
og dækker valgperiode 2004-2009
og dækker valgperiode 2004-2009
| Politikområde | Grad af enighed | Antal afstemninger |
|---|---|---|
| Environment, Public Health and Food Safety | 75 % | 383 |
| Foreign Affairs | 87 % | 306 |
| Civil Liberties, Justice and Home Affairs | 68 % | 264 |
| Industry, Research and Energy | 77 % | 238 |
| Budgetary Control | 89 % | 229 |
| Budgets | 81 % | 226 |
| Economic and Monetary Affairs | 84 % | 225 |
| Transport and Tourism | 80 % | 217 |
| Agriculture | 64 % | 211 |
| Internal Market and Consumer Protection | 84 % | 189 |
| Employment and Social Affairs | 71 % | 163 |
| Legal Affairs | 80 % | 140 |
| EP Delegation to Conciliation | 78 % | 133 |
| Culture and Education | 70 % | 130 |
| Regional Development | 76 % | 124 |
| Constitutional Affairs | 80 % | 116 |
| Fisheries | 64 % | 100 |
| International Trade | 88 % | 91 |
| Women's Rights and Gender Equality | 60 % | 78 |
| Development | 96 % | 45 |
| The enlarged Union for 2007-2013 | 76 % | 33 |
| Use of European countries by the CIA | 79 % | 19 |
| Petitions | 79 % | 19 |
| Climate Change | 56 % | 16 |