<< Tilbage til sammenligning af EU-stemmer
Sammenligning af stemmeafgivelser i Europa-parlamentet
 Dansk Folkeparti
vs.
Venstre
Dansk Folkeparti
vs.
Venstre 
Sammenligning af stemmeafgivelser i Europa-parlamentet
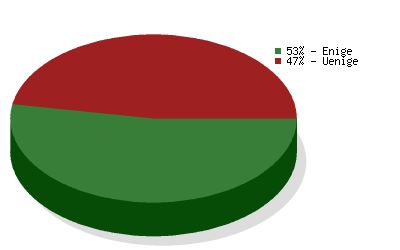
Sammenligningen er baseret på
5690 afstemninger
og dækker valgperiode 2004-2009
og dækker valgperiode 2004-2009
| Politikområde | Grad af enighed | Antal afstemninger |
|---|---|---|
| Environment, Public Health and Food Safety | 65 % | 577 |
| Foreign Affairs | 50 % | 403 |
| Budgets | 36 % | 363 |
| Civil Liberties, Justice and Home Affairs | 38 % | 332 |
| Economic and Monetary Affairs | 54 % | 314 |
| Transport and Tourism | 65 % | 289 |
| Agriculture | 55 % | 264 |
| Industry, Research and Energy | 77 % | 261 |
| Budgetary Control | 45 % | 241 |
| Internal Market and Consumer Protection | 50 % | 228 |
| Constitutional Affairs | 30 % | 223 |
| Employment and Social Affairs | 52 % | 200 |
| EP Delegation to Conciliation | 55 % | 163 |
| International Trade | 69 % | 153 |
| Legal Affairs | 60 % | 153 |
| Culture and Education | 36 % | 149 |
| Regional Development | 52 % | 140 |
| Fisheries | 41 % | 119 |
| Women's Rights and Gender Equality | 61 % | 95 |
| Development | 61 % | 82 |
| The enlarged Union for 2007-2013 | 27 % | 33 |
| Petitions | 70 % | 23 |
| Use of European countries by the CIA | 67 % | 21 |
| Climate Change | 44 % | 16 |